2012/07/12 CME
GCS paramters and measurements are shown in Measurement File
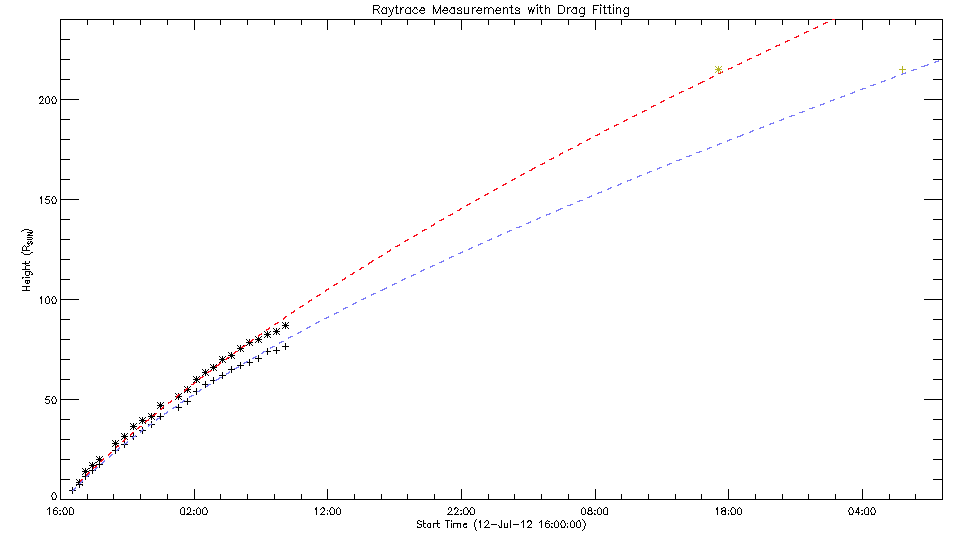
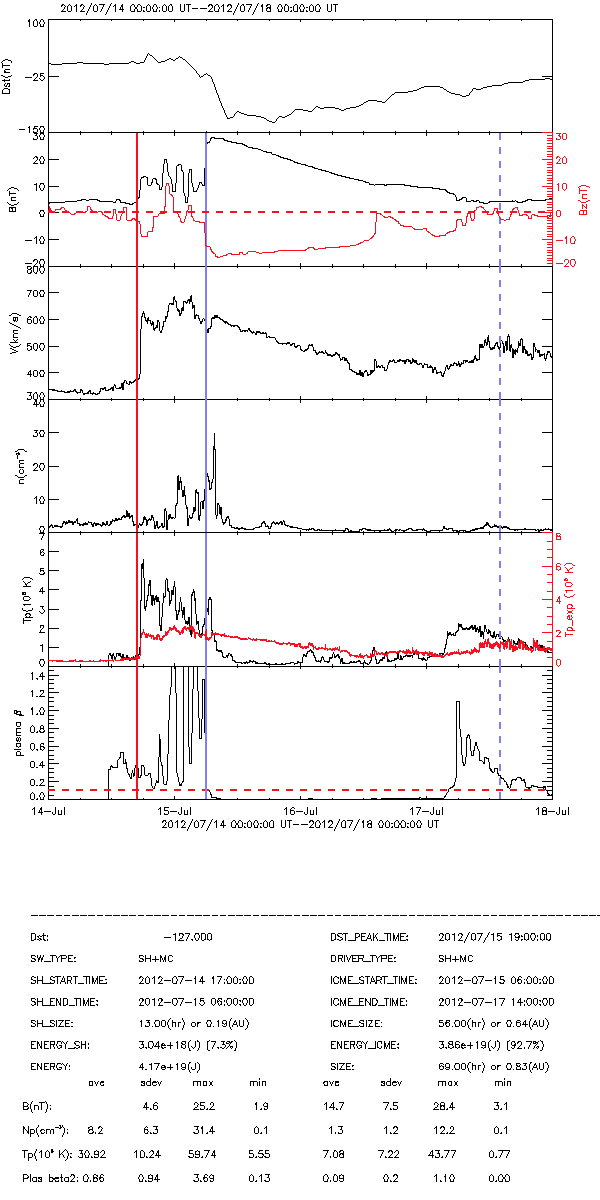
 This is the drag model fitting for my measurements of the July 14, 2012 ICME. The fitting parameters are
| Front |
Gamma (/km) |
V_0 (km/s) |
V_SW (km/s) (Determined by ACE) |
R_0 (R_S) |
| Shock |
1.47 e-8 |
1259.4 |
353.7 |
8.69 |
| Ejecta |
3.09 e-8 |
1316.5 |
353.7 |
4.29 |
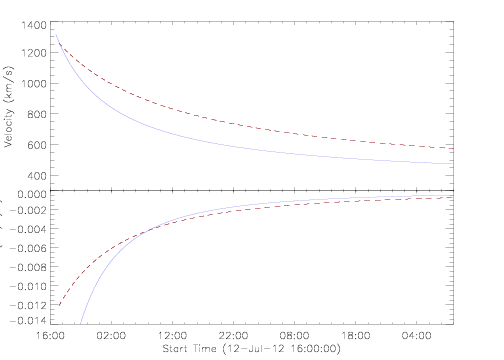
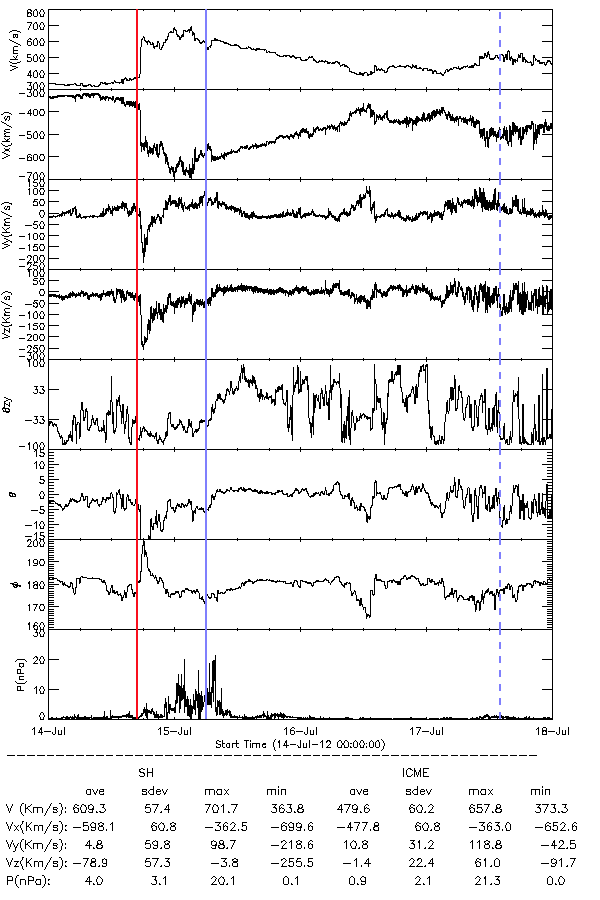
The flux rope has a higher initial velocity, but this is only because the initial measurement of the flux rope occured before the initial measurement of the shock. As you can see in the velocity profile, by the start of the shock fitting the ejecta has decelerated to a similar speed. The velocity profile shows the flux rope slowing down significantly faster than the shock. This is something I have seen in multiple events. It could be physically meaningful and a sign that the drag from the solar wind slows the ejecta down more rapidly than the shock. However, since I am fitting both fronts with the same model, using the same solar wind speed, it could just be a function of the model that the shock shows less drag since it arrives at ACE first.
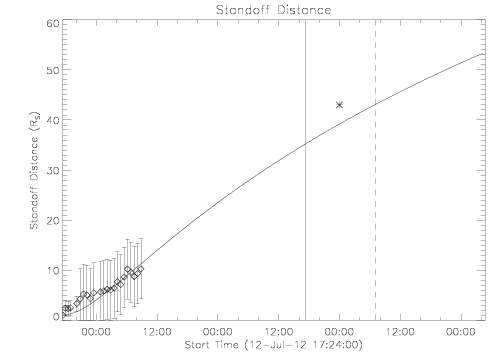
The next plot I have is the comparison of the standoff distance of the measurements, the model, and the integrated in-situ data. Given the amount of error on the measurements, these look pretty good
 This event has a very clear surface association with an X-class flare from AR 11520 beging at 15:36 UT.
AIA 171 video
HMI video
And the event is well observed by both STEREO A and B
This event has a very clear surface association with an X-class flare from AR 11520 beging at 15:36 UT.
AIA 171 video
HMI video
And the event is well observed by both STEREO A and B