GCS paramters and measurements are shown in Measurement File
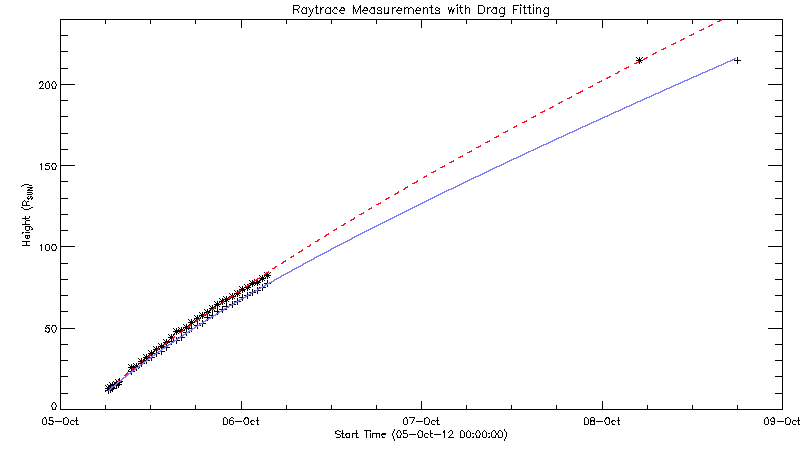
 This is the drag model fitting for my measurements of the October 08, 2012 ICME. The fitting parameters are
| Front |
Gamma (/km) |
V_0 (km/s) |
V_SW (km/s) (Determined by ACE) |
R_0 (R_S) |
| Shock |
2.11 e-8 |
757.9 |
328.8 |
12.64 |
| Ejecta |
4.49 e-8 |
775.1 |
328.8 |
11.57 |
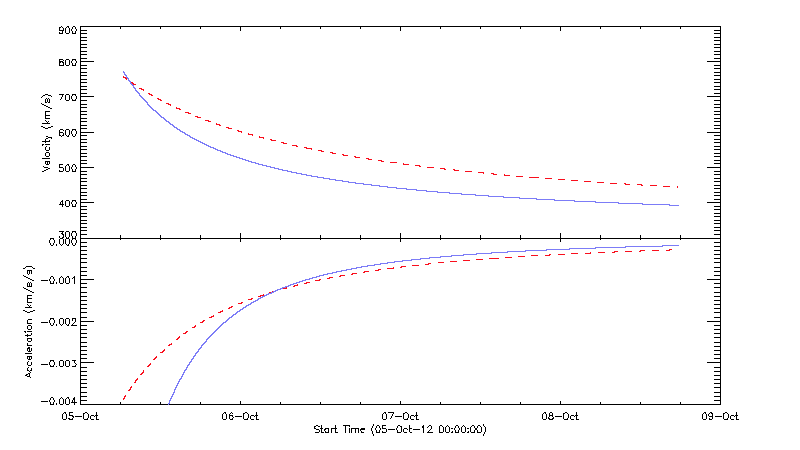
As you can see, the velocity/acceleration profiles match what we saw with the July 12 event, where the flux rope decelerates more rapidly than the shock. Also, you may notice that the drag fittings only start at 11.57 R_s. I have measurements down to about 4 R_s but threw the first 9 data points out.
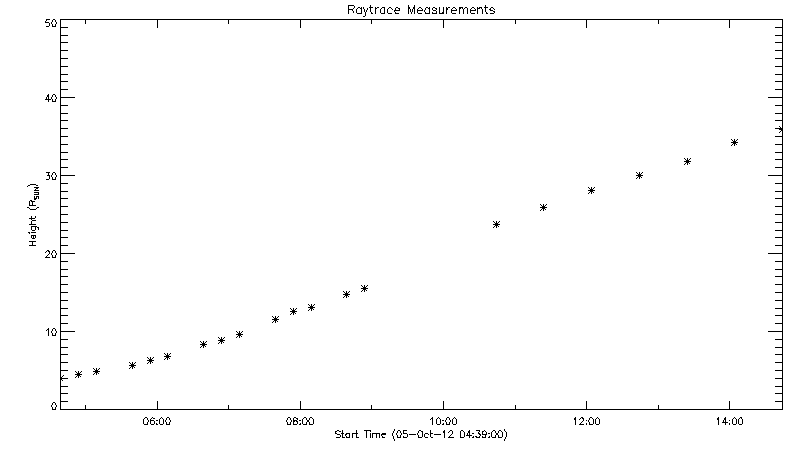 Over the first 10 or so R_s, the flux rope appears to be still accelerating. I think this makes sense, as this is the stealth event. My theory is that rather than an impulsive injection of energy from an explosive flare or prominence, instead there is a gradual input of energy that extends further out into the heliosphere. Since the model only accounts for things decelerating from an inital speed to a final speed, to get the model to accurately fit the data I had to remove these points.
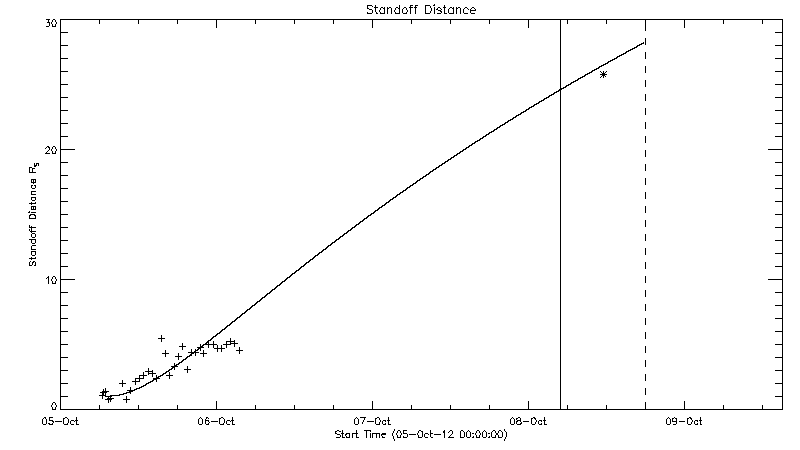
The next plot I have is the comparison of the standoff distance of the measurements, the model, and the integrated in-situ data. Given the amount of error on the measurements, these look pretty good
Over the first 10 or so R_s, the flux rope appears to be still accelerating. I think this makes sense, as this is the stealth event. My theory is that rather than an impulsive injection of energy from an explosive flare or prominence, instead there is a gradual input of energy that extends further out into the heliosphere. Since the model only accounts for things decelerating from an inital speed to a final speed, to get the model to accurately fit the data I had to remove these points.
The next plot I have is the comparison of the standoff distance of the measurements, the model, and the integrated in-situ data. Given the amount of error on the measurements, these look pretty good

 This event has been described as a "stealth" CME due to the lack of a clear surface signature. Near the appearance of the CME in coronagraphs, only this very weak minor eruption is visible.
AIA 193 video
AIA_304 video
However, there is a more obvious eruption earlier, around 15 UT. If this is indeed the surface signature, it must be explained why it takes about 12 hours for the CME to show up in the coronograph field of view.
AIA 171 video
AIA 193 video
AIA_304 video
And the event is well observed by both STEREO A and B
This event has been described as a "stealth" CME due to the lack of a clear surface signature. Near the appearance of the CME in coronagraphs, only this very weak minor eruption is visible.
AIA 193 video
AIA_304 video
However, there is a more obvious eruption earlier, around 15 UT. If this is indeed the surface signature, it must be explained why it takes about 12 hours for the CME to show up in the coronograph field of view.
AIA 171 video
AIA 193 video
AIA_304 video
And the event is well observed by both STEREO A and B